 /
/ 
Time Limit: 3 sec / Memory Limit: 1024 MiB
配点 : 525 点
問題文
N 行 M 列のグリッドが与えられます。上から i 行目では、左から L_i 列目から R_i 列目までのマスが黒く塗られており、それ以外のマスは白く塗られています。
Q 個のクエリが与えられます。各クエリでは、以下の問題に答えてください。
- 整数 A,B,C,D が与えられます。上から A 行目から B 行目まで、左から C 列目から D 列目までの長方形領域に含まれる黒いマスの個数を求めてください。
制約
- 1 \le N,M,Q \le 2\times10^5
- 1 \le L_i \le R_i \le M
- 各クエリについて、1 \le A \le B \le N
- 各クエリについて、1 \le C \le D \le M
- 入力される値はすべて整数
入力
入力は以下の形式で標準入力から与えられる。
N M Q
L_1 R_1
L_2 R_2
\vdots
L_N R_N
\mathrm{query}_1
\vdots
\mathrm{query}_Q
各クエリ \mathrm{query}_i ~ (1 \le i \le Q) は
A B C D
の形で与えられる。
出力
Q 行出力せよ。i 行目には、i 番目のクエリに対する答えを出力せよ。
入力例 1
3 6 3
2 4
1 1
4 6
1 2 1 4
2 3 3 6
1 1 5 6
出力例 1
4
3
0
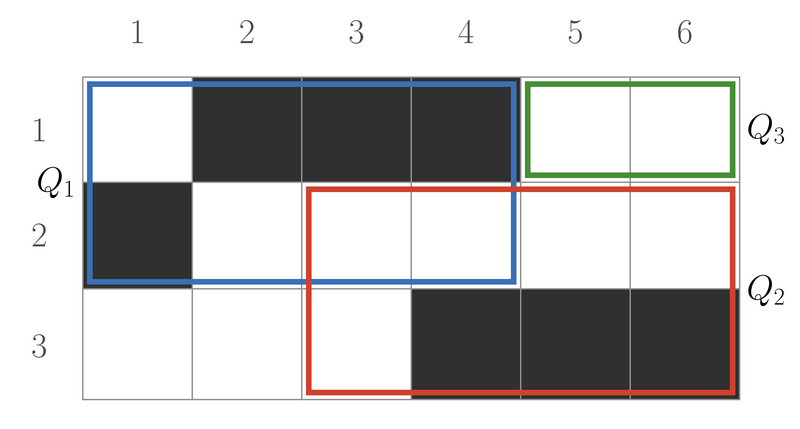
黒いマスは上図のような範囲にあり、1 番目のクエリでは左上の青い長方形、2 番目のクエリでは右下の赤い長方形、3 番目のクエリでは右上の緑の長方形の範囲の黒のマスの数を聞かれています。
よって、それぞれ 4, 3, 0 を出力すればよいです。
入力例 2
10 20 12
3 8
1 4
12 19
5 14
2 2
9 17
1 20
6 11
16 20
7 7
2 8 4 15
6 10 1 9
3 4 1 4
1 10 1 20
4 9 10 18
5 5 1 20
1 6 8 8
8 10 13 20
2 7 1 5
6 9 6 16
3 10 18 20
7 10 7 12
出力例 2
40
15
0
70
27
1
2
5
11
26
8
12
Score : 525 points
Problem Statement
You are given a grid with N rows and M columns. In the i-th row from the top, the squares from the L_i-th through R_i-th columns from the left are painted black, and the other squares are painted white.
You are given Q queries. For each query, answer the following question.
- You are given integers A,B,C,D. Find the number of black squares contained in the rectangular region from the A-th through B-th rows from the top and from the C-th through D-th columns from the left.
Constraints
- 1 \le N,M,Q \le 2\times10^5
- 1 \le L_i \le R_i \le M
- For each query, 1 \le A \le B \le N.
- For each query, 1 \le C \le D \le M.
- All input values are integers.
Input
The input is given from Standard Input in the following format:
N M Q
L_1 R_1
L_2 R_2
\vdots
L_N R_N
\mathrm{query}_1
\vdots
\mathrm{query}_Q
Each query \mathrm{query}_i ~ (1 \le i \le Q) is given in the form
A B C D
Output
Output Q lines. The i-th line should contain the answer to the i-th query.
Sample Input 1
3 6 3
2 4
1 1
4 6
1 2 1 4
2 3 3 6
1 1 5 6
Sample Output 1
4
3
0
The black squares are located as shown in the figure above. The 1-st query asks for the number of black squares within the blue rectangle at the upper left, the 2-nd query within the red rectangle at the lower right, and the 3-rd query within the green rectangle at the upper right.
Thus, output 4, 3, 0, respectively.
Sample Input 2
10 20 12
3 8
1 4
12 19
5 14
2 2
9 17
1 20
6 11
16 20
7 7
2 8 4 15
6 10 1 9
3 4 1 4
1 10 1 20
4 9 10 18
5 5 1 20
1 6 8 8
8 10 13 20
2 7 1 5
6 9 6 16
3 10 18 20
7 10 7 12
Sample Output 2
40
15
0
70
27
1
2
5
11
26
8
12